Building high-quality labeled datasets is one of the most complex aspects of creating reliable AI systems. This is especially true in fields like autonomous mobility, where a single labeling error can affect how a vehicle perceives its environment. In open-ended tasks such as image captioning, text summarization, or content generation, labeling quality can be challenging to define or measure.
It is not always clear what a “good” label looks like. Two people might describe the same image or summarize the same paragraph in completely different ways. Both could seem correct, but their differences make evaluation confusing and inconsistent.

This subjectivity affects how models learn and perform. To fix this, we need a way to describe quality that is clear, consistent, and measurable. The answer lies in transforming human perception of quality into a form that computers can understand and process, creating a computable form of quality.
Quality Rubric is a structured framework that transforms subjective expectations into clear, computable, and testable metrics for data and AI systems. For example, instead of saying an image annotation should “look accurate,” the rubric defines measurable rules, like setting a minimum Intersection over Union (IoU) score or specific alignment thresholds for better consistency across all annotations.
Let’s explore how it can help build consistent and reliable AI datasets for autonomous vehicles and mobility applications.
Defining Data Quality Through Human Perception
In AI systems, especially in autonomous mobility, how humans perceive data quality has direct consequences on model performance and safety. If data is considered “good” by one team but misses critical details needed by another, the AI may learn incomplete or misleading patterns. These gaps can lead to errors in object detection, decision-making, or navigation, which may have a significant impact on real-world outcomes.
Consider an AV engineer reviewing LiDAR data, who may call it “excellent” because it captures a dense 3D map of the road. A perception modeler may disagree, saying the same data is cluttered and difficult to process. Both are right, as their view of quality depends on what they need from the data.
Quality is often shaped by how people see and experience a product or result, i.e., human bias and experience shape these perceptions. Factors such as usability, aesthetics, or even the intuitiveness of data can influence how people perceive quality. This experience factor makes quality a mix of emotional, functional, and technical dimensions and not just precision and accuracy.
However, traditional QA metrics like accuracy, precision, or recall fail to capture this human side. They measure correctness but not usefulness or intent. A dataset can score high on accuracy yet still perform poorly in a real-world scenario if it does not reflect real conditions or user needs.
To make quality scalable, we must translate perception into a computable metric. By converting subjective expectations into measurable signals like “lane markings should be continuous” or “objects must appear natural in context, teams can align human intuition with machine precision for better data quality that is consistent, explainable, and fit for purpose.
The Challenge: Translating the Abstract into the Measurable
Turning vague ideas of “good” into concrete checks is harder than it sounds. The following lists some challenges:
- Teams often start with abstract goals such as “accurate labeling” or “complete coverage.” Translating these into precise and testable criteria requires a deep understanding of the data and its context. Without clear rules and examples, annotators and reviewers can interpret the same task in different ways. This leads to inconsistent data and mixed results.
- Even when teams agree on what quality means or rules are defined, turning those rules into metrics like thresholds or scoring formulas can be tricky. Common metrics like agreement scores (for example, Cohen’s kappa) or gold-standard test sets help, but they need to be updated and maintained to stay useful.
- Subjectivity also makes it difficult, especially when scaling AV data operations. Teams working across different locations or time zones may interpret labeling rules differently. Without clear standards, errors can multiply as datasets grow. This slows development and increases the time spent on rework or manual review.
- The challenge becomes even greater when data comes from multiple sources. For example, a dataset might combine images, LiDAR point clouds, and radar data. Each has different properties, formats, and error types that can make it difficult to apply consistent quality checks. What looks “accurate” in one modality might not even exist in another.
To prevent this, teams need a shared language for quality. One that humans and machines can both understand. Defining what “good” means in measurable terms ensures consistent and safe datasets for autonomous driving systems.
Building the Framework: The Quality Rubric Approach
A Quality Rubric turns human expectations into measurable rules. It does this by breaking down abstract goals such as “accuracy” or “clarity” into specific and verifiable criteria. This helps teams move from vague ideas of “good” to clear and testable criteria that machines can understand.
For example, a simple goal like “vehicles should be labeled accurately” can be broken down into measurable checks. These may include bounding box overlap, class accuracy, and distance error. Once these rules are in place, quality can be tracked automatically instead of relying on personal judgment.
Here is how it works:
- Start with human intent: Define the human expectation. For instance, in the case of training data for an autonomous vehicle system, an intent might be to make the objects on the road look more natural. A quality rubric covering this intent can be the desired shape or color of relevant objects against the background.
- Translate into parameters and constraints: Break down the expectation into measurable elements, such as:
- max_aspect_ratio: The maximum allowable aspect ratio for the object.
- alignment_threshold: The acceptable alignment of the object within the frame.
- IoU_minimum: The minimum Intersection over Union (IoU) score for object detection.
- Encode into system-level validation checks and metrics: Implement these parameters into the AI system’s validation processes, ensuring that outputs are evaluated against these predefined criteria.
This approach makes it easier to align teams and maintain consistent data quality, even when datasets are large or complex. By converting abstract goals into data-driven rules, the Quality Rubric ensures that every frame, object, and edge case meets the same standard of precision and usability.
The Anatomy of Quality Metrics
Data quality is not defined by a single factor, as it depends on the use case or problem it will solve. For instance, in a low-stakes classification task, quality means how well the data helps a model learn accurate patterns and generalize to new situations. In mobility, which refers to technologies like autonomous driving, drones, or delivery robots, quality has an added meaning: safety and reliability.
To ensure both learning accuracy and operational safety, AI and mobility systems must break “quality” into clear components that reflect how data supports safe and reliable decisions. The Quality Rubric brings these factors together through nine data quality metrics.
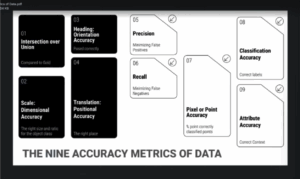
- Intersection over Union: Measures how closely the labeled area matches the actual object. Higher IoU means more accurate boundaries.
- Scale accuracy: Checks whether objects are labeled correctly in size and proportion. This helps models learn real-world relationships between objects.
- Orientation accuracy: Ensures objects are marked with the right direction or rotation, which is important for tasks like self-driving or robotics.
- Positional accuracy: Looks at how precisely an object is placed in the image or frame. Even small shifts can affect detection results.
- Precision: Measures how many of the detected objects are correct. High precision means fewer false positives.
- Recall: Checks how many real objects were correctly identified. High recall means fewer misses or false negatives.
- Point or pixel accuracy: Focuses on fine details, such as the correctness of pixel-level segmentation or point clouds in 3D data.
- Classification accuracy: Ensures that each object or instance is given the right label or class.
- Attribute accuracy: Verifies that all related details, like color, type, or speed, are correctly recorded.
Each of these metrics captures a different aspect of how “correct” or “complete” a dataset is. When integrated into the Quality Rubric, they become adjustable dimensions, each with its own weight and priority depending on project needs.
At iMerit, every data project begins with a rubric design phase, where teams and clients define what quality means for their specific use case. Together, they build validation rules that link human expectations to machine-checkable metrics. This approach ensures data is accurate, context-aware, and aligned with the safety goals of autonomous mobility.
Integrating Real-World Impact: iMerit’s Case Study
To see how this approach works in practice, iMerit partnered with a leading automotive supplier to improve model performance in traffic light recognition and vulnerable road user detection.
Challenge: The client struggled to accurately identify traffic lights and pedestrians across diverse urban environments, which impacted the performance of their autonomous systems.
Solution:iMerit implemented a customized automation platform that included:
- Polyline annotation: To enable precise road boundary detection.
- Cuboid directionality: For accurate 3D object localization.
- Advanced versioning and auditing: Ensuring data reliability and compliance with industry standards, including TISAX certification.
Outcome: The enhanced dataset led to significant improvements in detection accuracy, particularly in complex urban environments. An automotive customer reported a 40% increase in annotation accuracy and a 50% reduction in time per task compared with the prior vendor. They also reported better model interpretability and increased safety in real-world deployments.
Evolving from Manual Checks to Automated Validation
In the past, quality checks in data labeling were mostly done by people. Reviewers looked at samples and marked them as correct or incorrect based on their judgment. While this approach works well for small projects, it becomes slow and inconsistent as the dataset grows. Different reviewers may interpret the same rule in different ways, resulting in inconsistent outcomes.
With a Quality Rubric, this process can be automated. Each rule in the rubric is written in a way that machines can understand and check. For example, a script can measure if the bounding box IoU meets the minimum threshold or if a label matches the correct class. These automated checks can run across thousands of samples in seconds.
This shift also enables a feedback loop between data, models, and quality systems. Once outputs are scored against the rubric, the results feed back into model retraining or annotation refinement. Poorly performing samples are flagged for human review, while high-confidence results are used to strengthen the next iteration of the model. Over time, this cycle reduces human intervention while continuously improving dataset reliability and model performance.
Below is an example workflow for integrating the quality rubric into an automated data quality pipeline:
- Data Output: Model predictions or labeled samples are generated.
- Automated Scoring: The Quality Rubric evaluates outputs against predefined metrics (e.g., IoU ≥ 0.85, attribute accuracy ≥ 95%).
- Quality Classification: Samples are tagged as pass, flag, or fail based on scoring thresholds.
- Feedback Integration: Failed samples are sent for targeted human review or retraining data collection.
- Continuous Learning: Insights from the review process update the rubric and model training pipeline.
This automated workflow transforms quality assurance from a reactive, human-heavy task into a proactive, scalable system. Instead of rechecking every sample manually, teams focus on refining the rubric and improving performance through continuous feedback and measurable standards.
Benefits of a Computable Quality Rubric
Implementing a computable quality rubric provides several key advantages:
- Removes ambiguity: Everyone evaluates quality based on the same measurable rules, reducing personal bias.
- Faster validation and scalability: Automated checks reduce the need for full manual review. Projects with millions of frames or point clouds can maintain high standards without slowing down development.
- Ensures alignment across teams: Engineers, QA, product managers, and customers share a common understanding of what “quality” means.
- Adapts over time: As quality expectations evolve, the rubric can be updated to keep metrics relevant and accurate.
- Improves model reliability: Consistent quality checks lead to cleaner datasets, more reliable model behavior, and better end-user outcomes.
- Consistency: A quality rubric ensures that annotators in different locations follow the same standards. Whether labeling LiDAR, camera, or radar data, everyone knows what counts as accurate.
- Safety and reliability: For AV systems, even small errors can be critical. Clear rules and feedback loops help catch mistakes before they reach the model, improving overall safety.
Balancing Computation with Human Judgment
Even with a fully codified quality rubric, human perception is still important. For example, in autonomous mobility, data might meet every measurable standard, yet subtle errors or unusual scenarios can affect real-world performance. User experience, safety perception, and contextual understanding continue to define the ultimate sense of “quality.”
The goal is not to replace human judgment but to capture its essence. Turning these expert insights into simple and measurable rules lets teams apply human-level quality across large amounts of data, such as images, point clouds, and videos. This makes the process more consistent and reliable without losing the benefits of human understanding.
Key aspects of the human touch include:
- Human-in-the-loop review: Experts examine edge cases, anomalies, and complex scenarios.
- Feedback-driven refinement: Human feedback and insights help update rubrics and improve model accuracy.
- Balance between humans and machines: Automation handles routine validation, while humans focus on judgment-heavy tasks.
This combination ensures data is trustworthy, precise, and ready for safe deployment in mobility systems.
Conclusion
Quality is no longer just a matter of opinion. In autonomous mobility, safe and reliable AI depends on accurate, measurable data. A well-designed Quality Rubric converts human expectations into computable rules, helping teams maintain high standards at scale.
Key Takeaways:
- Quality in AV data requires both human insight and automated checks.
- Clear and measurable rules make large-scale datasets consistent and reliable.
- Human-in-the-loop review ensures edge cases and complex scenarios are captured.
- Iterative refinement of rubrics allows data to adapt and improve over time.
At iMerit, quality is built from the ground up. The process begins with workflow customization to ensure alignment between human expertise and algorithmic standards.
Expert annotators apply domain-specific guidelines, supported by AI-assisted tools that help detect inconsistencies and automate validation. This seamless integration of people, process, and technology ensures that every dataset meets measurable benchmarks for accuracy, relevance, and safety.
Whether it’s perception data for autonomous vehicles, LiDAR segmentation, or complex multi-sensor fusion, iMerit’s quality framework transforms raw data into a trusted foundation for scalable and high-performing mobility systems. Partner with iMerit to turn your data into a trusted foundation for high-performing, reliable autonomous systems.